
Macro Thoughts - Getting over the hurdle with Lockheed Martin
Macro Thoughts - Getting over the hurdle with Lockheed Martin

Hi everyone,
A little while ago, I wrote about the headwind that corporate margins could be for equities using Union Pacific as an example. Today I’m going to touch on the other elephant in the room, which is the rise in fixed income yields, aka the “risk-free rate”.
It goes without saying that interest rates have had quite the year. With both the rate of change and volatility being simply off the charts. Using the US 10yr as a broad proxy for interest rates, here’s a chart worth more than a thousand words.
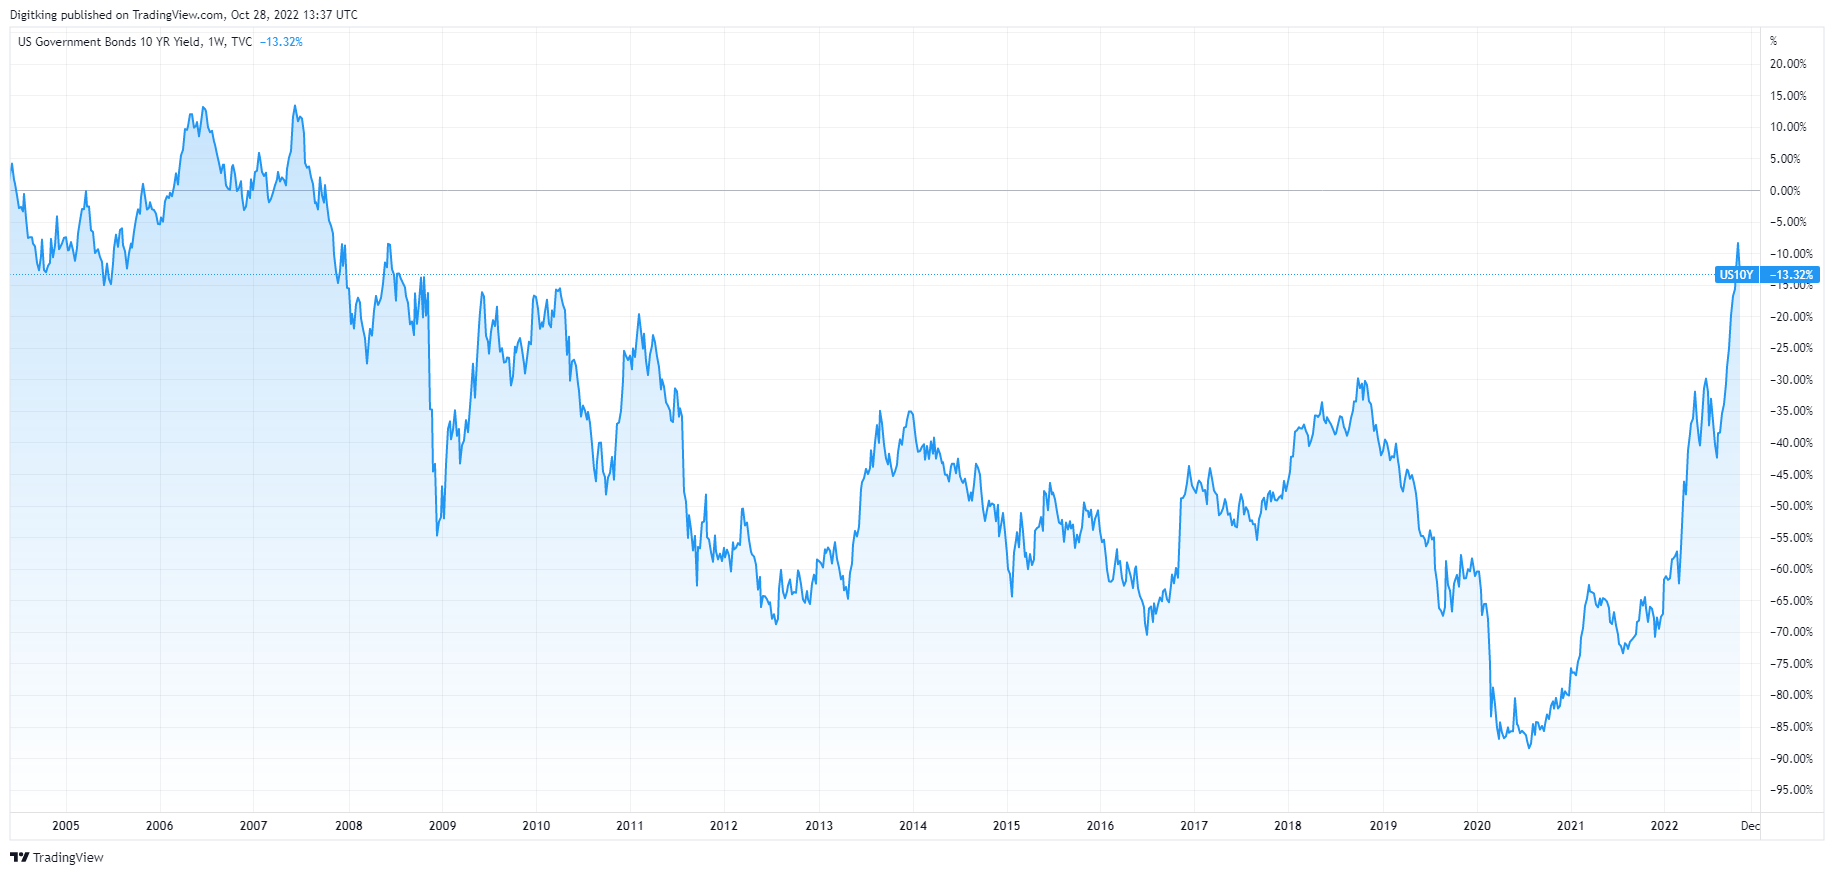
US 10yrs has completely broken out of the post-GFC trading range and it’s caused massive amounts of pain to all asset owners (bonds, equities, etc.). As an equity investor, this number is pretty important as it’s the “risk-free rate” that we use to calculate things like CAPM (capital asset pricing model) or WACC (weighted adjusted cost of capital).
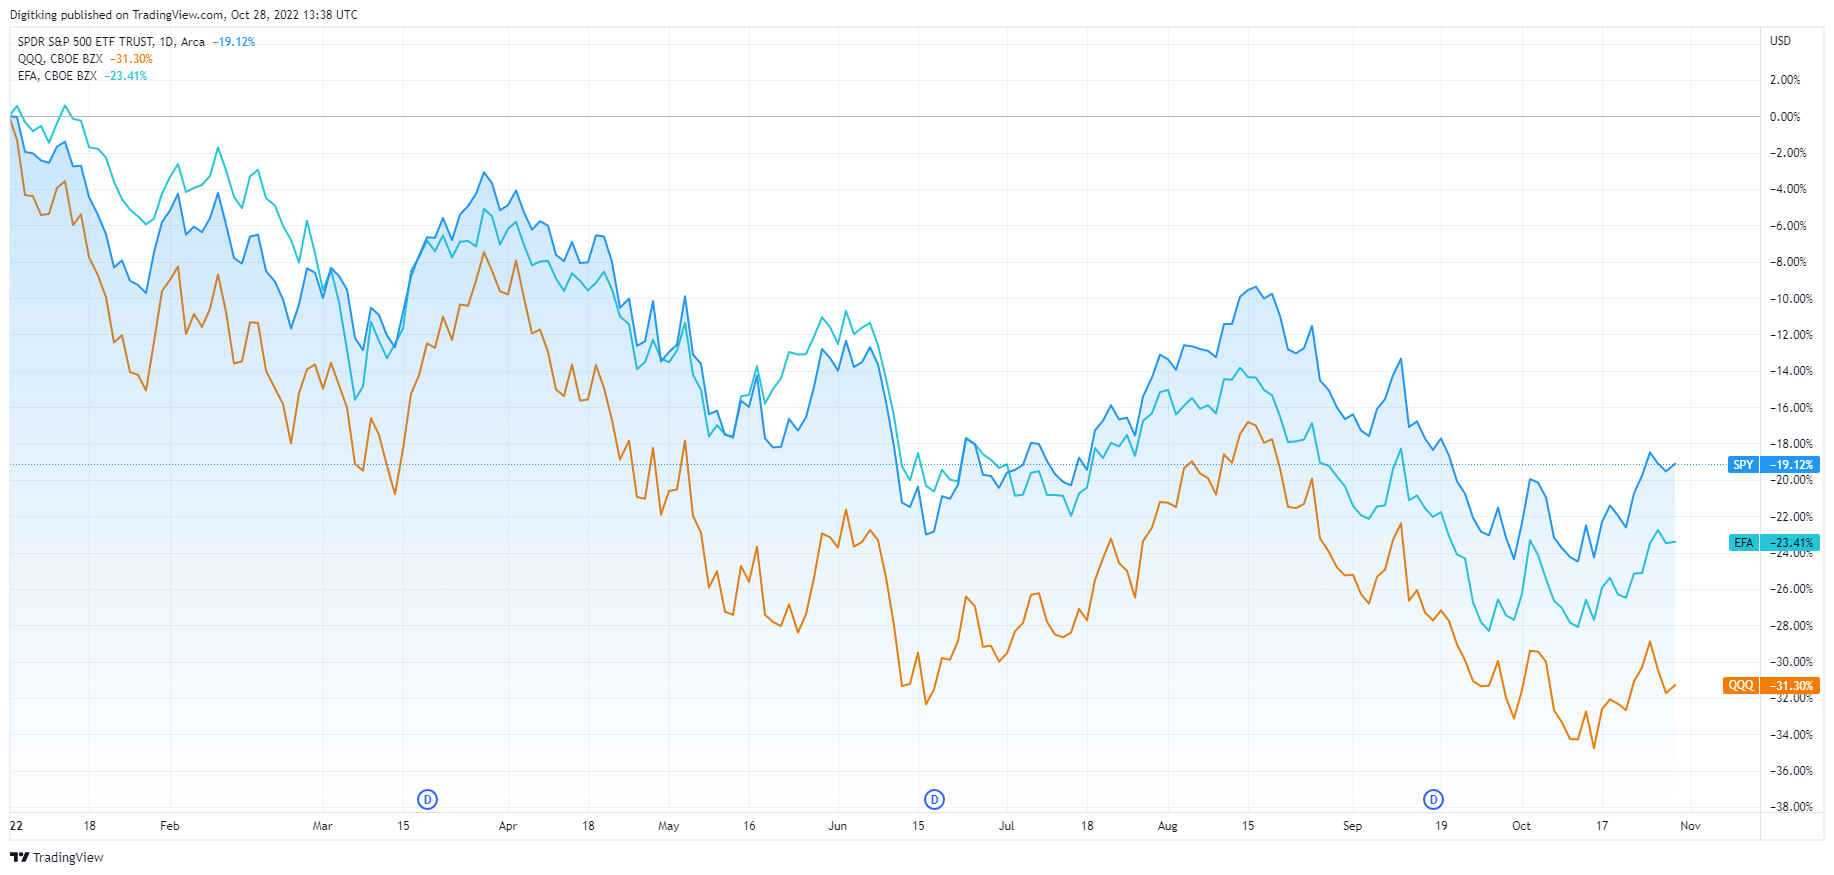
So it should come as no surprise that equity markets are largely trading tick for tick with interest rates this year. And that’s meant a very tough year for investors with the S&P down ~19%, Nasdaq ~31%, and EAFE (Europe, Australasia, and Far East) down ~23%.
But this got me thinking, is a 20% decline enough to offset the rise in risk-free rates? It’s impossible to know (at least for me). So instead I’ve decided to take one of my more boring long-term holdings, Lockheed Martin, and put it to the test. For those that aren’t familiar with Lockheed Martin (symbol LMT), it’s one of the world’s largest aerospace and defense companies in the world and developed the F-22, F-35 & C-130 Hercules (just to name a few).
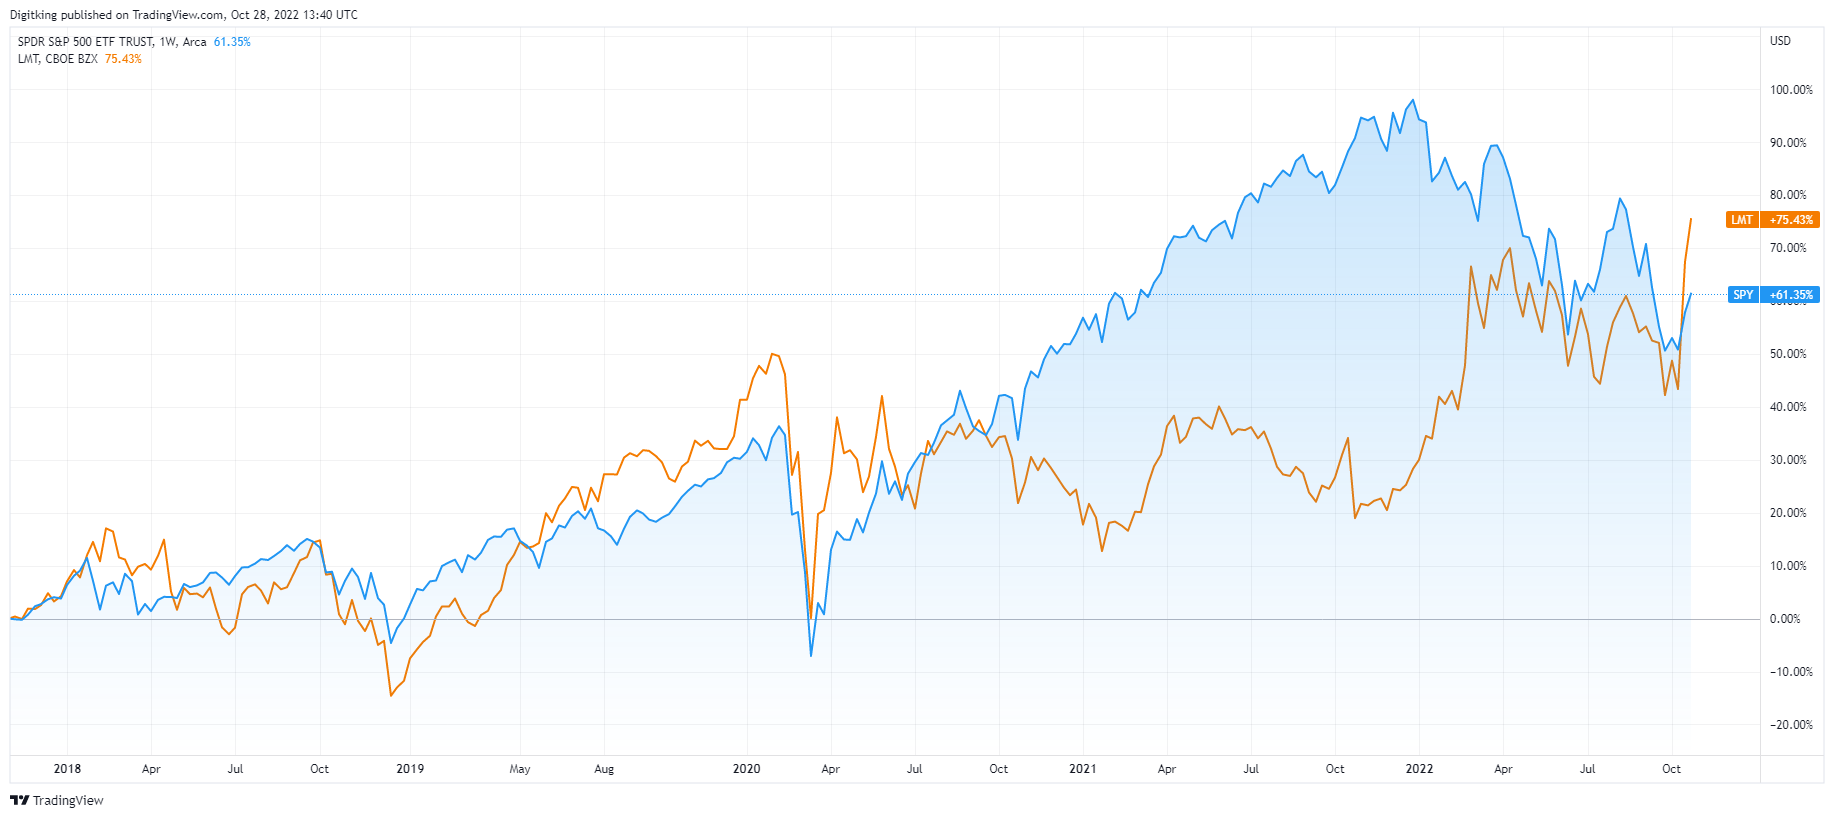
Year-to-date, the company is massively outperforming the S&P (+31% vs -20%). This is likely due to the Ukraine war increasing investor expectations of higher revenue growth as well as investors hiding out in healthcare and defense amidst the market carnage. But over the last 5 years, LMT’s returns have been slightly better than the overall market (using SPY) thanks to it’s recent surge (12.5% CAGR versus 10.4% for the S&P):
I chose to look at LMT because I’m familiar with the name and because it’s a very mature business which makes it “easier” (relatively speaking) to value. I also wondered if because of the focus on the war in Ukraine, investors in the stock have become overly complacent in the rise in bond yields.
As LMT is a big and mature company, using a simple dividend discount model to ballpark its value shouldn’t be unreasonable. To do that, we need a couple of things. A growth rate (g), the dividend rate (d), and the discount rate which is made up of the equity risk premium (ERP), the risk-free rate (Rf), and the beta (b).
First, let’s start by calculating the discount rate. For the risk-free rate, we can use the US 10yr which I showed above at ~4.0%. LMT’s beta has been pretty stable over the last decade at around 0.7x. The equity risk premium (ERP) is the toughest part though. Data from Ed Yardeni of Yardeni Research shows that ERP varies wildly from as low as 0.5% (peak of the Dotcom boom) to as high as 12% (the early 1980s and the “Death of Equities cover) but generally has been between 4% and 8%.
Alternatively, research from Robeco that Joachim Klement highlighted on his blog (found here) that ERP moves somewhat inversely with interest rates (i.e. when rates are low, ERP rises and vice versa). This would imply an equity discount rate of between 8% and 10% and from there you back out the ERP.
To avoid going further down the ERP rabbit hole, I’ll just use a 6% ERP which is roughly the average from Yardeni and combined with a 4% risk-free rate gives you a 10% equity return which is in line with Robeco’s research. Of course, we have to factor in LMT’s beta which gets you an 8.2% discount rate (4% + 0.7 * 6%).
Now for the growth rate. Since 2012, LMT has grown revenues by ~3.5% CAGR. But at the same time, US CPI has increased by ~2.75% CAGR (I’m rounding both figures and there is no “military defense inflation” rate so I used CPI instead) which results in a real revenue growth rate of 0.75% CAGR (3.5% - 2.75%).
This leads to the obvious question, assuming that the real growth rate is stable at 0.75%, what does inflation look like for the next 5 or 10 years? Futures markets, such as the 5yr 5yr forward inflation expectation rate, imply that inflation will fall back towards 2%-2.5% pretty quickly.
On the flip side. History says that once inflation has jumped up like what we’ve seen, it’s taken much longer for inflation to recede. This is something that Stanley Druckenmiller discussed earlier this year and something Patrick Saner recently highlighted:


I have no idea which side of the argument turns out to be right but I’m leaning more towards the side that inflation will be sticky and slower to fall than Central bankers and investors would like to see.
Back of the napkin, if I guesstimate that inflation is 7% next year, and it then falls linearly by 1% each year until it reaches 2% (2028) and stays there for the remainder of the 10 years (2032), this works out to an annual inflation rate of ~3.5% over the next ten years.
It’s by no means perfect, but 3.5% inflation doesn’t sound that extreme and when combined with 0.75% of real growth gives a total (i.e. nominal) growth rate of 4.25%.
Lastly, there’s the current dividend, but that’s by far the easiest thing to observe ($11.20/share).
So we have all the components, now we just have to run the numbers. The standard dividend discount model is just:
(Dividend * (1 + Growth)) / (Discount rate - Growth)
Plugging it all in, we get an approximate value of $295/share. Meanwhile, the shares are just closed at $485/share. Doh! This is quite a ways off as it implies almost a 40% drop in the share price!
Let’s compare this to the “pre-Covid assumptions”. If we assumed a 2% risk-free rate and a 6% equity risk premium we’d have a 6.2% discount rate. If we assumed a 3.5% nominal growth rate we get a value of $430/share which is a lot closer (only 10% off).
One input that I’m likely underestimating is future growth that investors are now baking into the company’s share price. Politicians across the world are pledging to dramatically increase their defense budgets (particularly in Europe & Japan). But defense procurement cycles are measured in decades and whether increased spending in the years to come shows up in LMT’s revenues before the end of the decade is questionable.
Second, defense spending is top of mind for voters and politicians right now due to the war in Ukraine. But will it still be after the war is over and politicians face very tough budget constraints and tradeoffs with rising interest payments, aging demographics, etc.?
Nevertheless, if we go back to the original projection and assume that instead of 0.75% real growth, the company will see 1.5% real growth. Combined with 3.5% inflation over the next decade means a 5% nominal growth rate. Keeping everything else the same, we still only get to ~$365/share, or about 25% less than the current value.
If we reduce the risk-free rate to 3.25% which lowers the overall discount rate to 7.45% but keep a 5% nominal growth rate, we can get to $480/share value.
There are a couple of problems with this though. First, if we do get 5% nominal growth and a 3.25% risk-free rate, that would imply that the share price is now “fairly” valued and there’s no upside (at least alpha) remaining.
Secondly, it implies that the risk-free rate (using the US 10yr) at 3.25% will be less than inflation which is at 3.5%. This might very well be the case and lots of very smart people have said that we should expect a decade of “financial repression”. But will investors really accept it once they realize what’s happening? Or will it be another case of what the UK saw? I have no idea.
Anyways, here’s a summary of the four cases that I’ve laid out:

Of course, there’s an infinite number of possible outcomes and 10 years is a long-time. But hopefully, this shows you just how sensitive LMT’s valuation is if interest rates remain high.
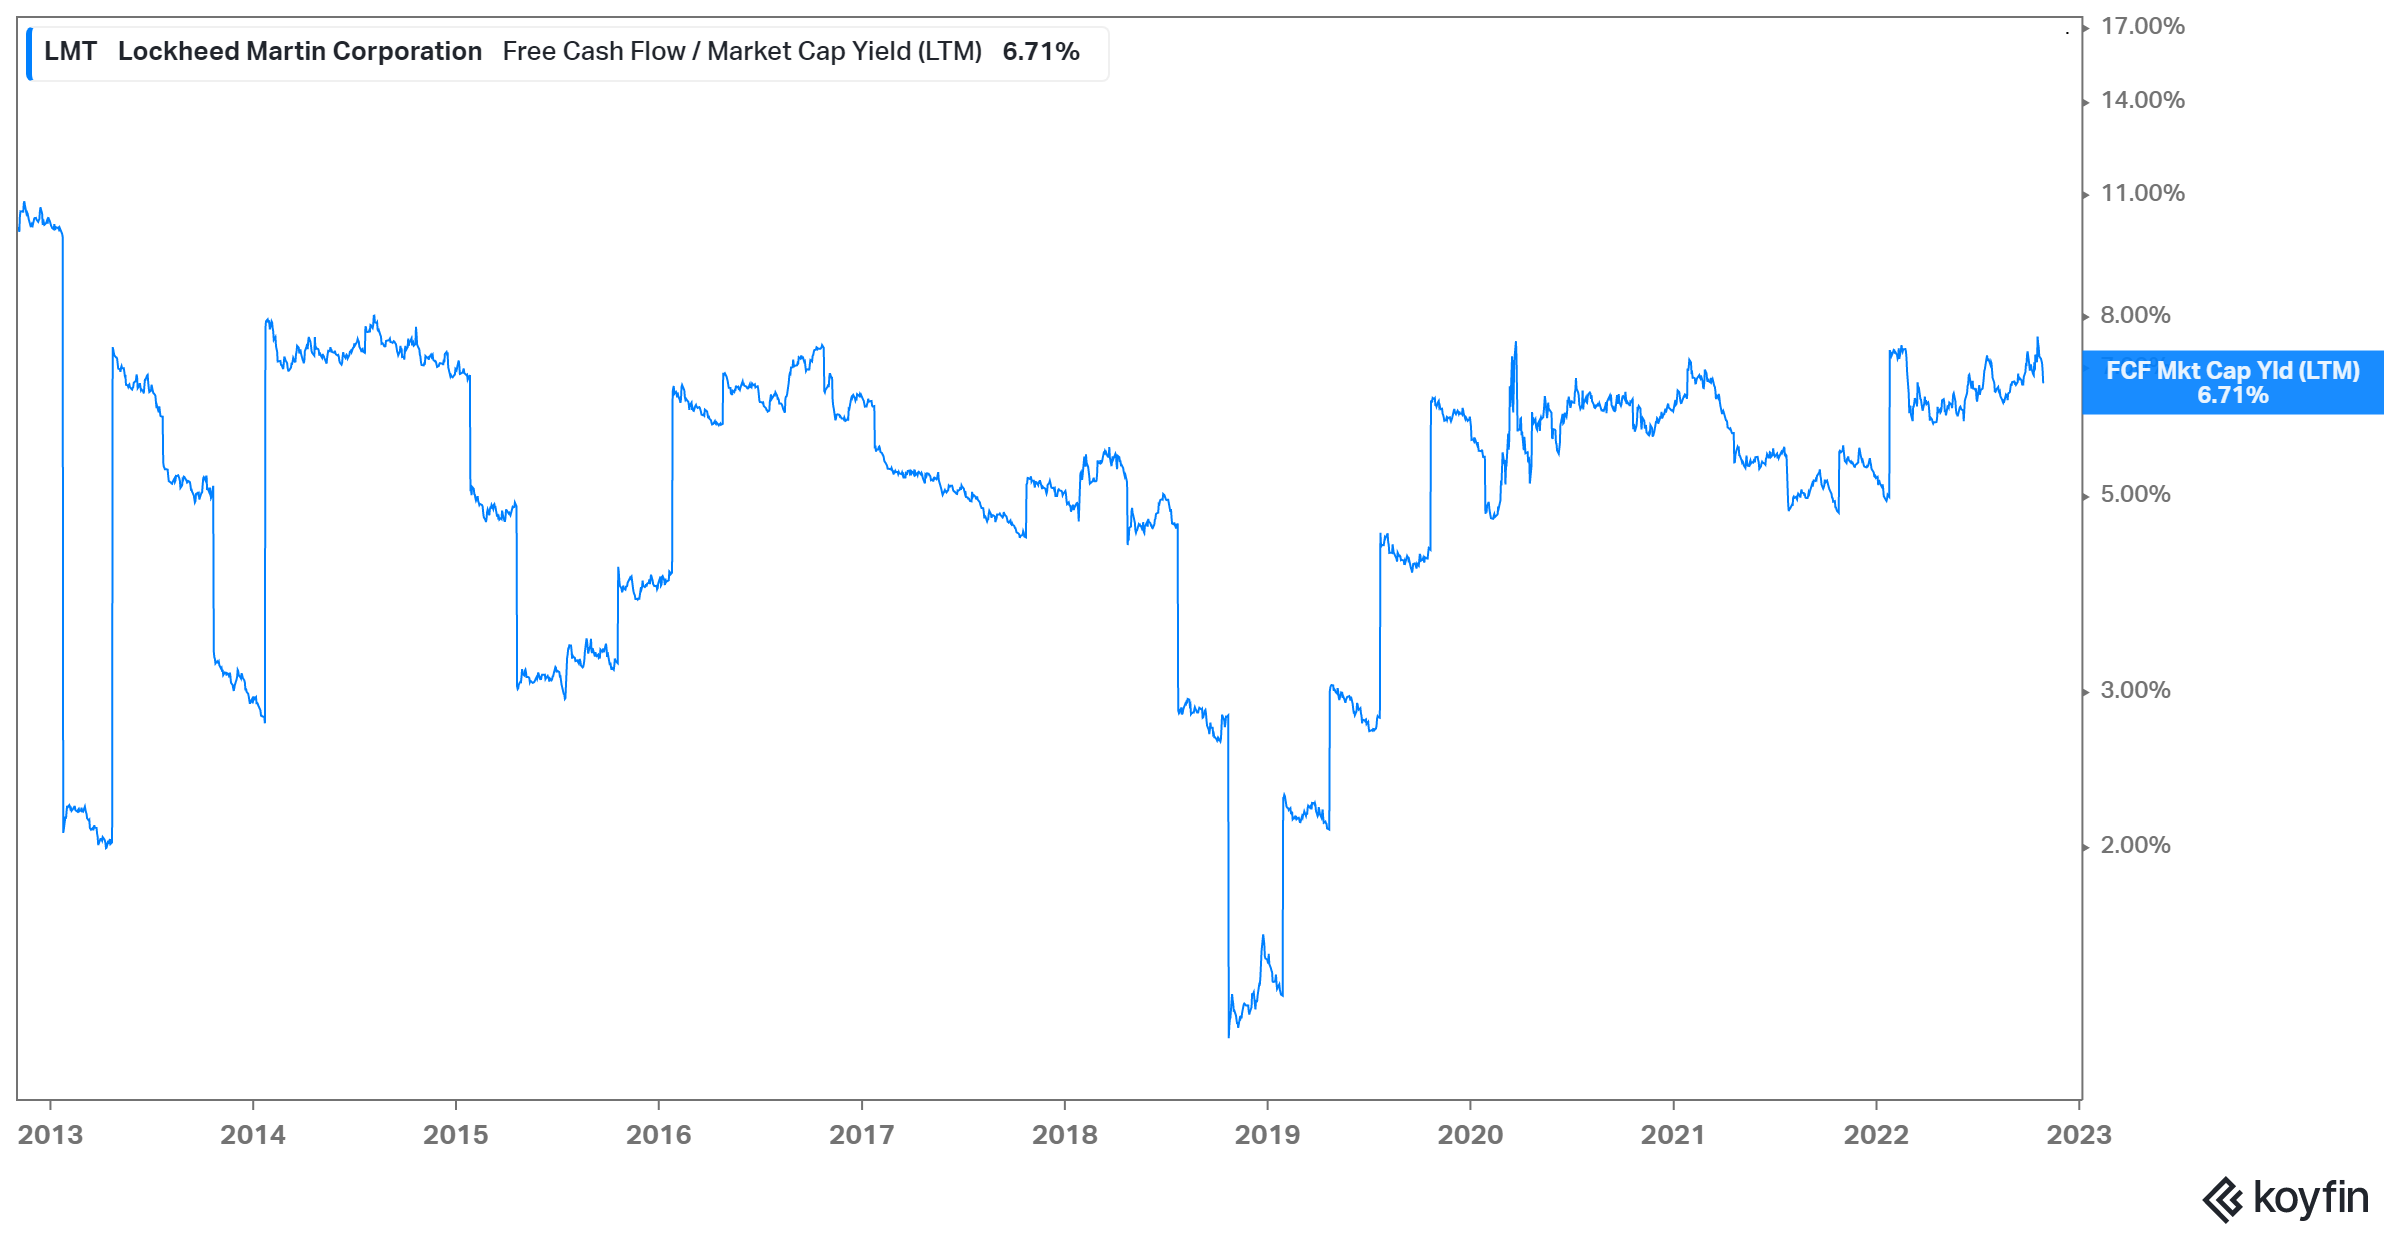
Lastly, while LMT has been a rockstar performance-wise, the company’s free cash flow yield has been pretty consistent around 5%-6% (average is 5.35%). This could be viewed as a very compelling TINA (there are no other alternatives) of a ZIRP or NIRP world. But now that yields have risen, is a 6% FCF yield still compelling?
LQD, which is the iShares Investment Grade Corporate Bond ETF has a ~5.8% YTM ( approximately 40% of the returns will be in the form of capital gains) with 1/3 of the realized volatility. Likewise, HYG is a high-yield ETF has an 8.4% YTM (35% of returns will be capital gains) and has also realized about 1/3 of the volatility of LMT (LQD and HYG have realized almost the exact same volatility over the last 3 years which is stunning to think about but we’re getting off-topic).
When (if ever) do investors large and small decide that a 2.5% dividend yield with mid-single-digit growth prospects just isn’t good enough considering the newly available alternatives?
While this post has been exclusively focused on LMT, there are at least half a dozen other blue-chip stocks that I could name off the top of my head that are in for a similar situation too. How it plays remains to be seen (I have no idea) but along with corporate margins, it’s going to be an incredible tug-of-war!
As for me and my LMT holdings, it’s been a great run but I think I’ll be bowing out soon for better risk/reward scenarios. And besides, cash (and bonds) isn’t trash anymore!
Disclosure: I am long and have a beneficial interest in all of the above-mentioned securities. I may change my holdings at any time post-publication.
Disclaimer: This newsletter and/or any other articles that I publish should not be construed as investment advice. None of the strategies or securities mentioned should be considered as an investment recommendation to buy or sell. I am not an investment advisor and I highly recommend that anyone considering this investment strategy or any of the securities first consult with a registered investment advisor to assess both the suitability and risk of any strategies or securities that are mentioned.