
Macro Thoughts - Squeezing Blood From A Stone
Macro Thoughts - Squeezing Blood From A Stone

Edit: I’m out in Eastern Canada and we’re just getting back to normal after Hurricane Fiona so this article is a week delayed (I couldn’t quite get it done before the storm). However, a bunch of companies have already come out and warned on profits which adds to the thesis.
Hi everyone,
In last week’s Sleepy Portfolio Update, I referenced the possible strike action in the railroad sector and how the railway workers would be getting some fairly hefty raises and one-time bonuses from the negotiations.
While the workers are demanding higher pay, they’re also demanding sick leave and guaranteed paid time off. Considering the work that railroad workers do and the risks involved; you’d think they’d have sick leave and PTO already?
At the crux of the dispute is “Precision Scheduled Railroading (PSR)”. PSR was developed by the late Hunter Harrison (of CNR, CP & CSX fame) that emphasizes point-to-point freight car movements to optimize efficiency and improve productivity.
A less charitable version of PSR is that it’s just an excuse for railroad companies to cut costs and reduce staffing to the absolute minimum to improve profitability. The remaining employees are forced to work longer hours and be on call almost permanently to keep everything running smoothly.
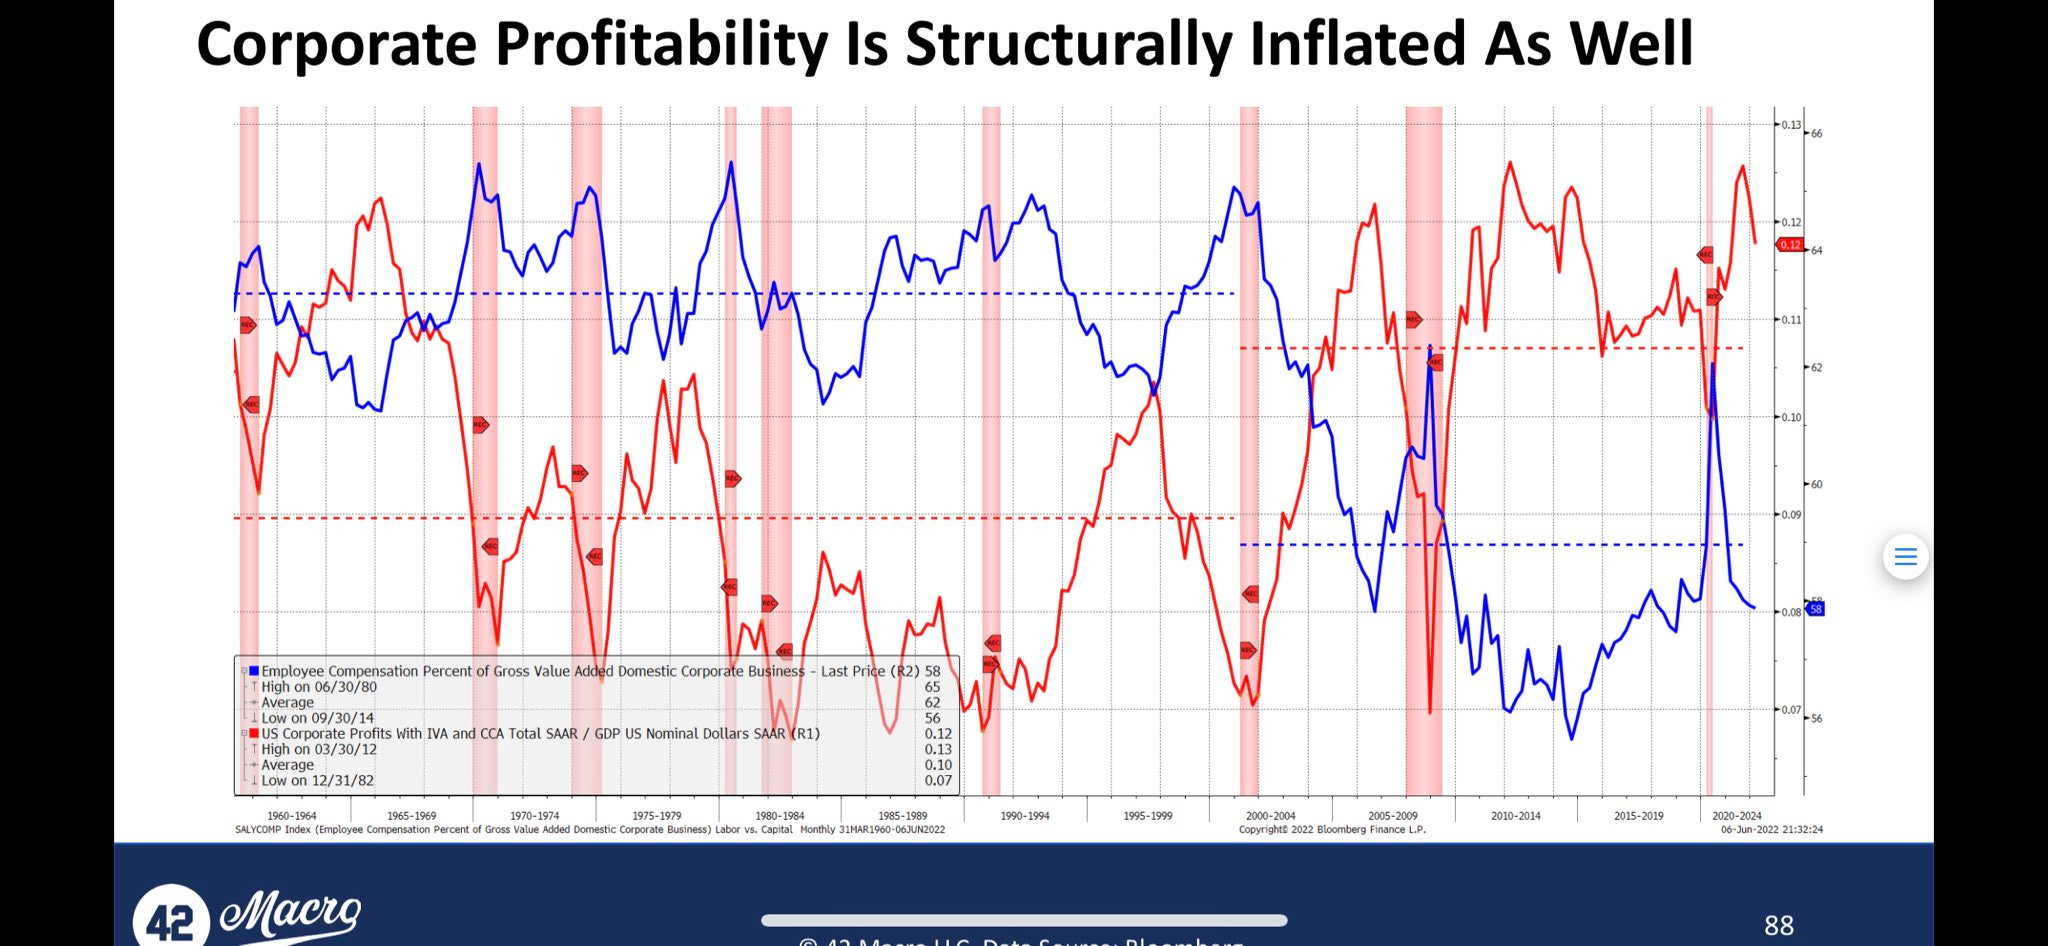
As I’ve been reading more about the situation it got me thinking about corporate margins and how sustainable they might be going forward. It also reminded me of this chart on corporate profitability from Darius Dale at 42 Macro which I highlighted in a past article. The red line is corporate profit margins, while the blue line is the employee share.
At the same time, Stanley Druckenmiller re-appeared and discussed at length how he thought that the markets may go nowhere for the next decade.
So out of curiosity, I decided to do some digging in the railroad sector. I looked into Union Pacific (UNP) which is the largest publicly traded railroad company. While the following analysis only looks at UNP, it can be broadly applicable to many companies across the US (albeit with their own nuisances).
For full disclosure, I have no position in UNP or any other railway at the time of writing this.
Squeezing Blood From A Stone
In 2018, UNP adopted and began implementing PSR. See if you can notice a change in the following charts. Here’s a chart of UNP’s total employees and freight revenue per employee:
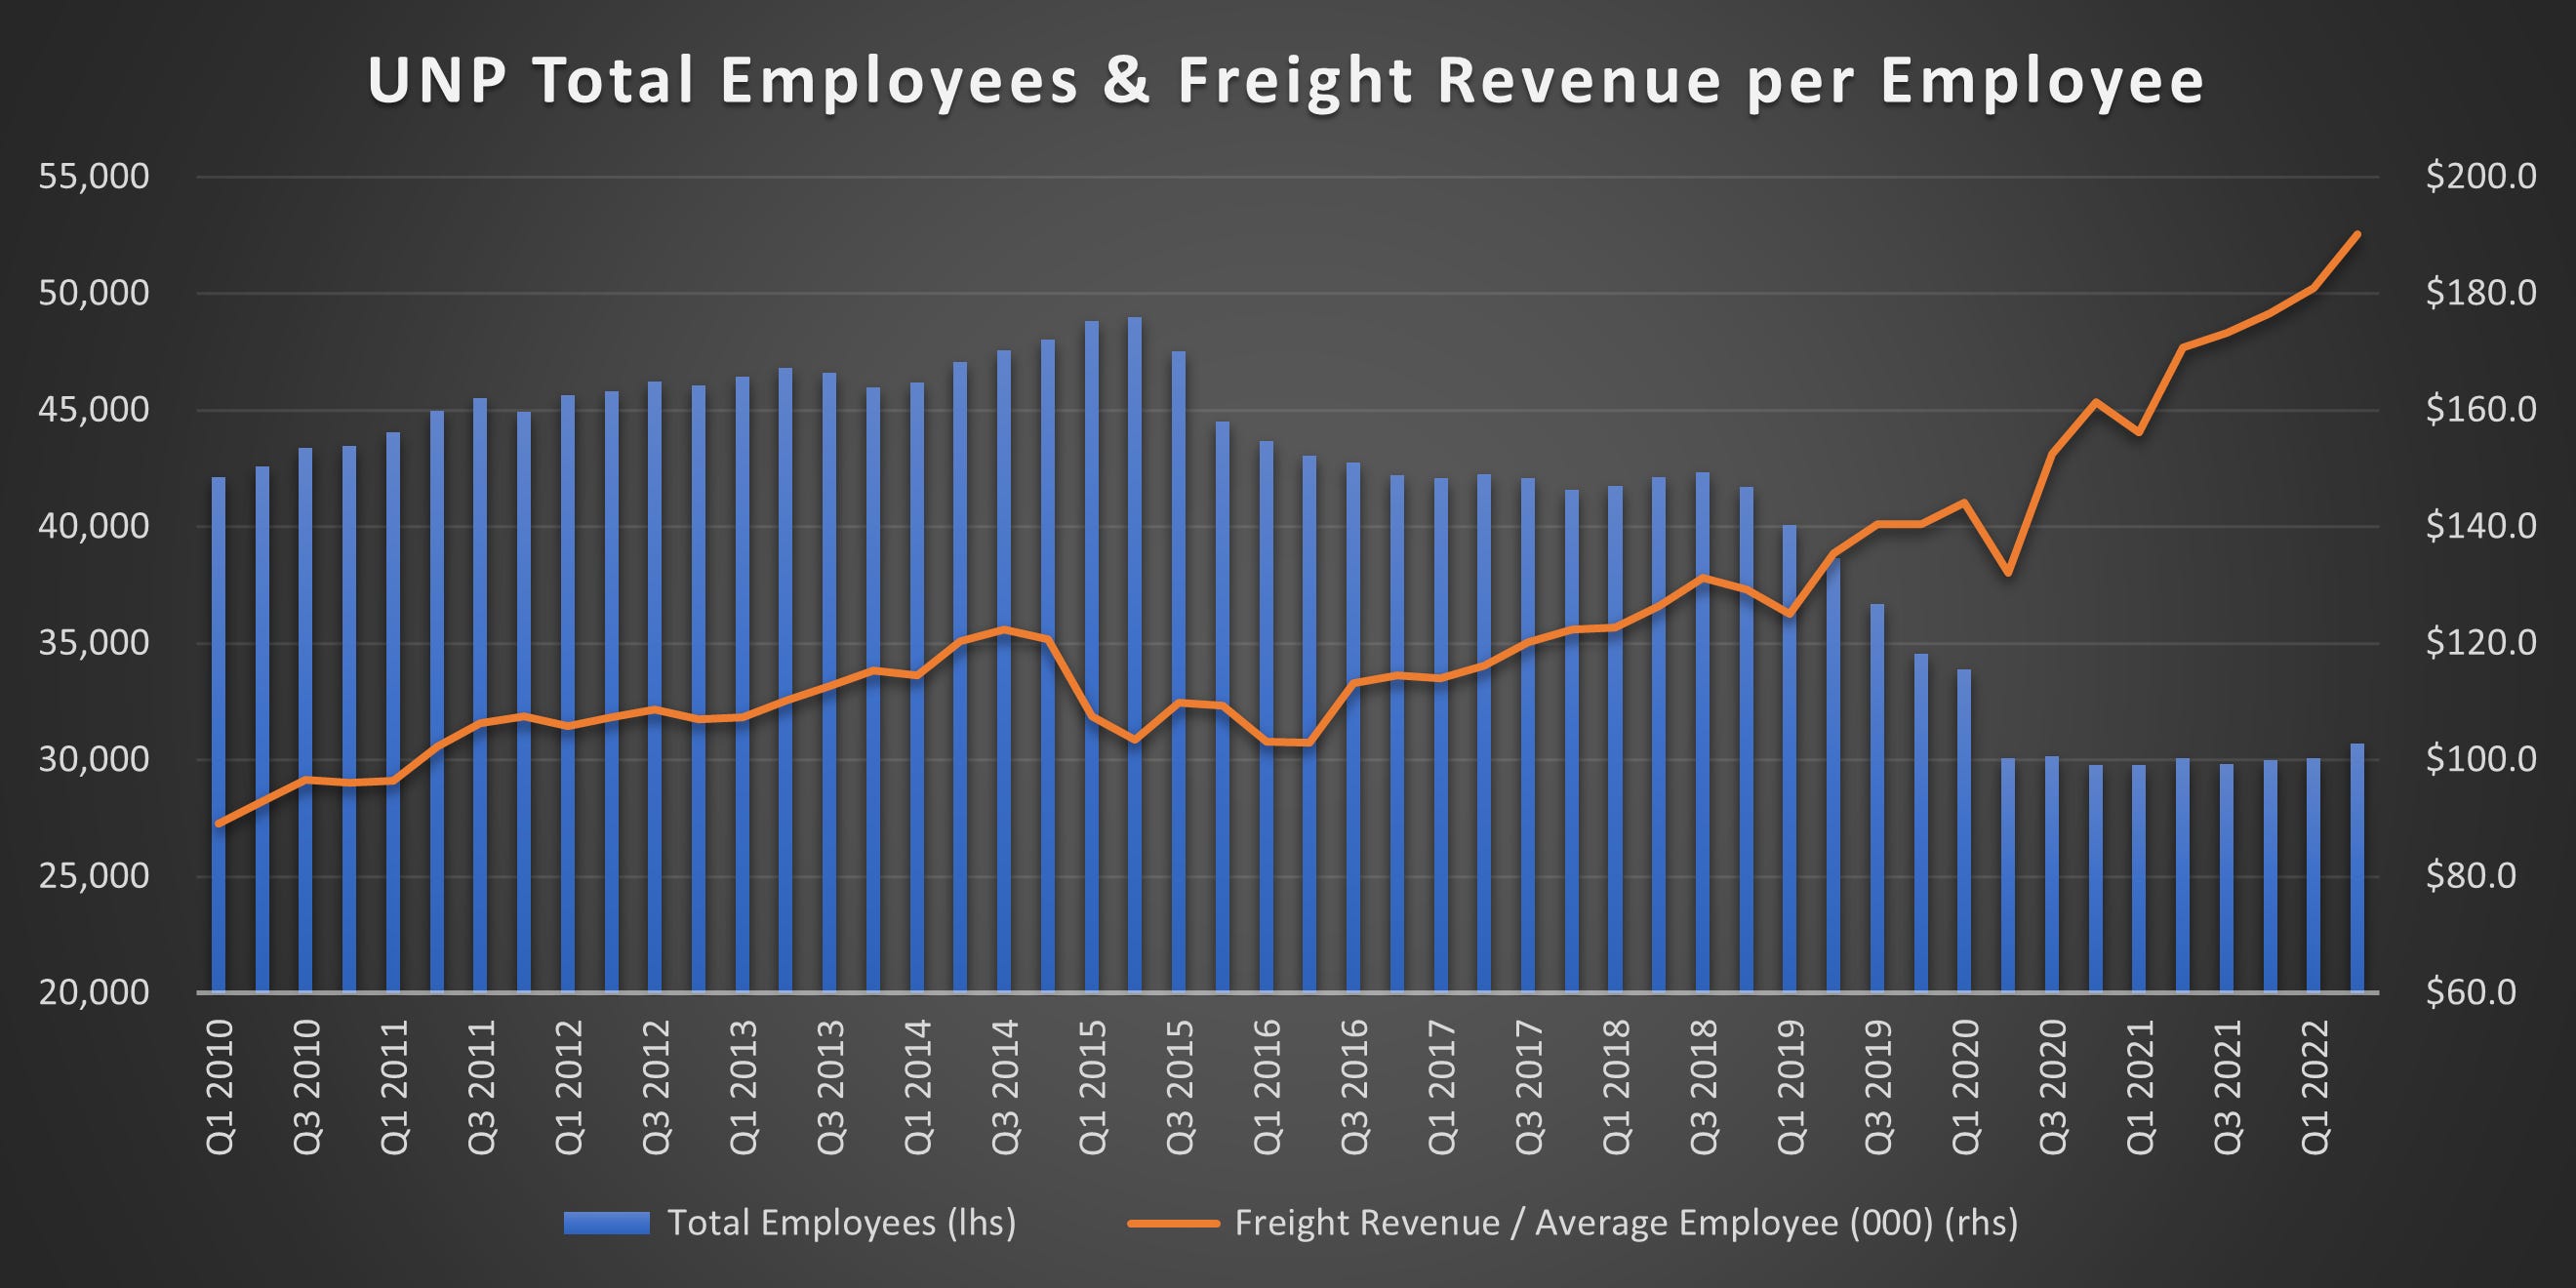
There were job cuts in 2015/2016 when the economy stalled out but an even bigger reduction of staff due to PSR in 2018 and Covid in 2020. At the beginning of this decade, UNP has ~42k employees. Employment peaked at 48k employees and is now just over 30k employees (a ~30% reduction in staff from the start of the decade and almost a 40% reduction from its peak).
Meanwhile, the average revenue per employee on a trailing twelve months basis has gone from ~$375k in 2010 to ~$720k now (the chart shows quarterly results so remember to multiply by 4).
You would think that reducing staffing by almost a third would materially slow down the business, but he’s barely changed. Here’s UNP’s gross-ton-miles (GTM) and the freight revenue per GTM:
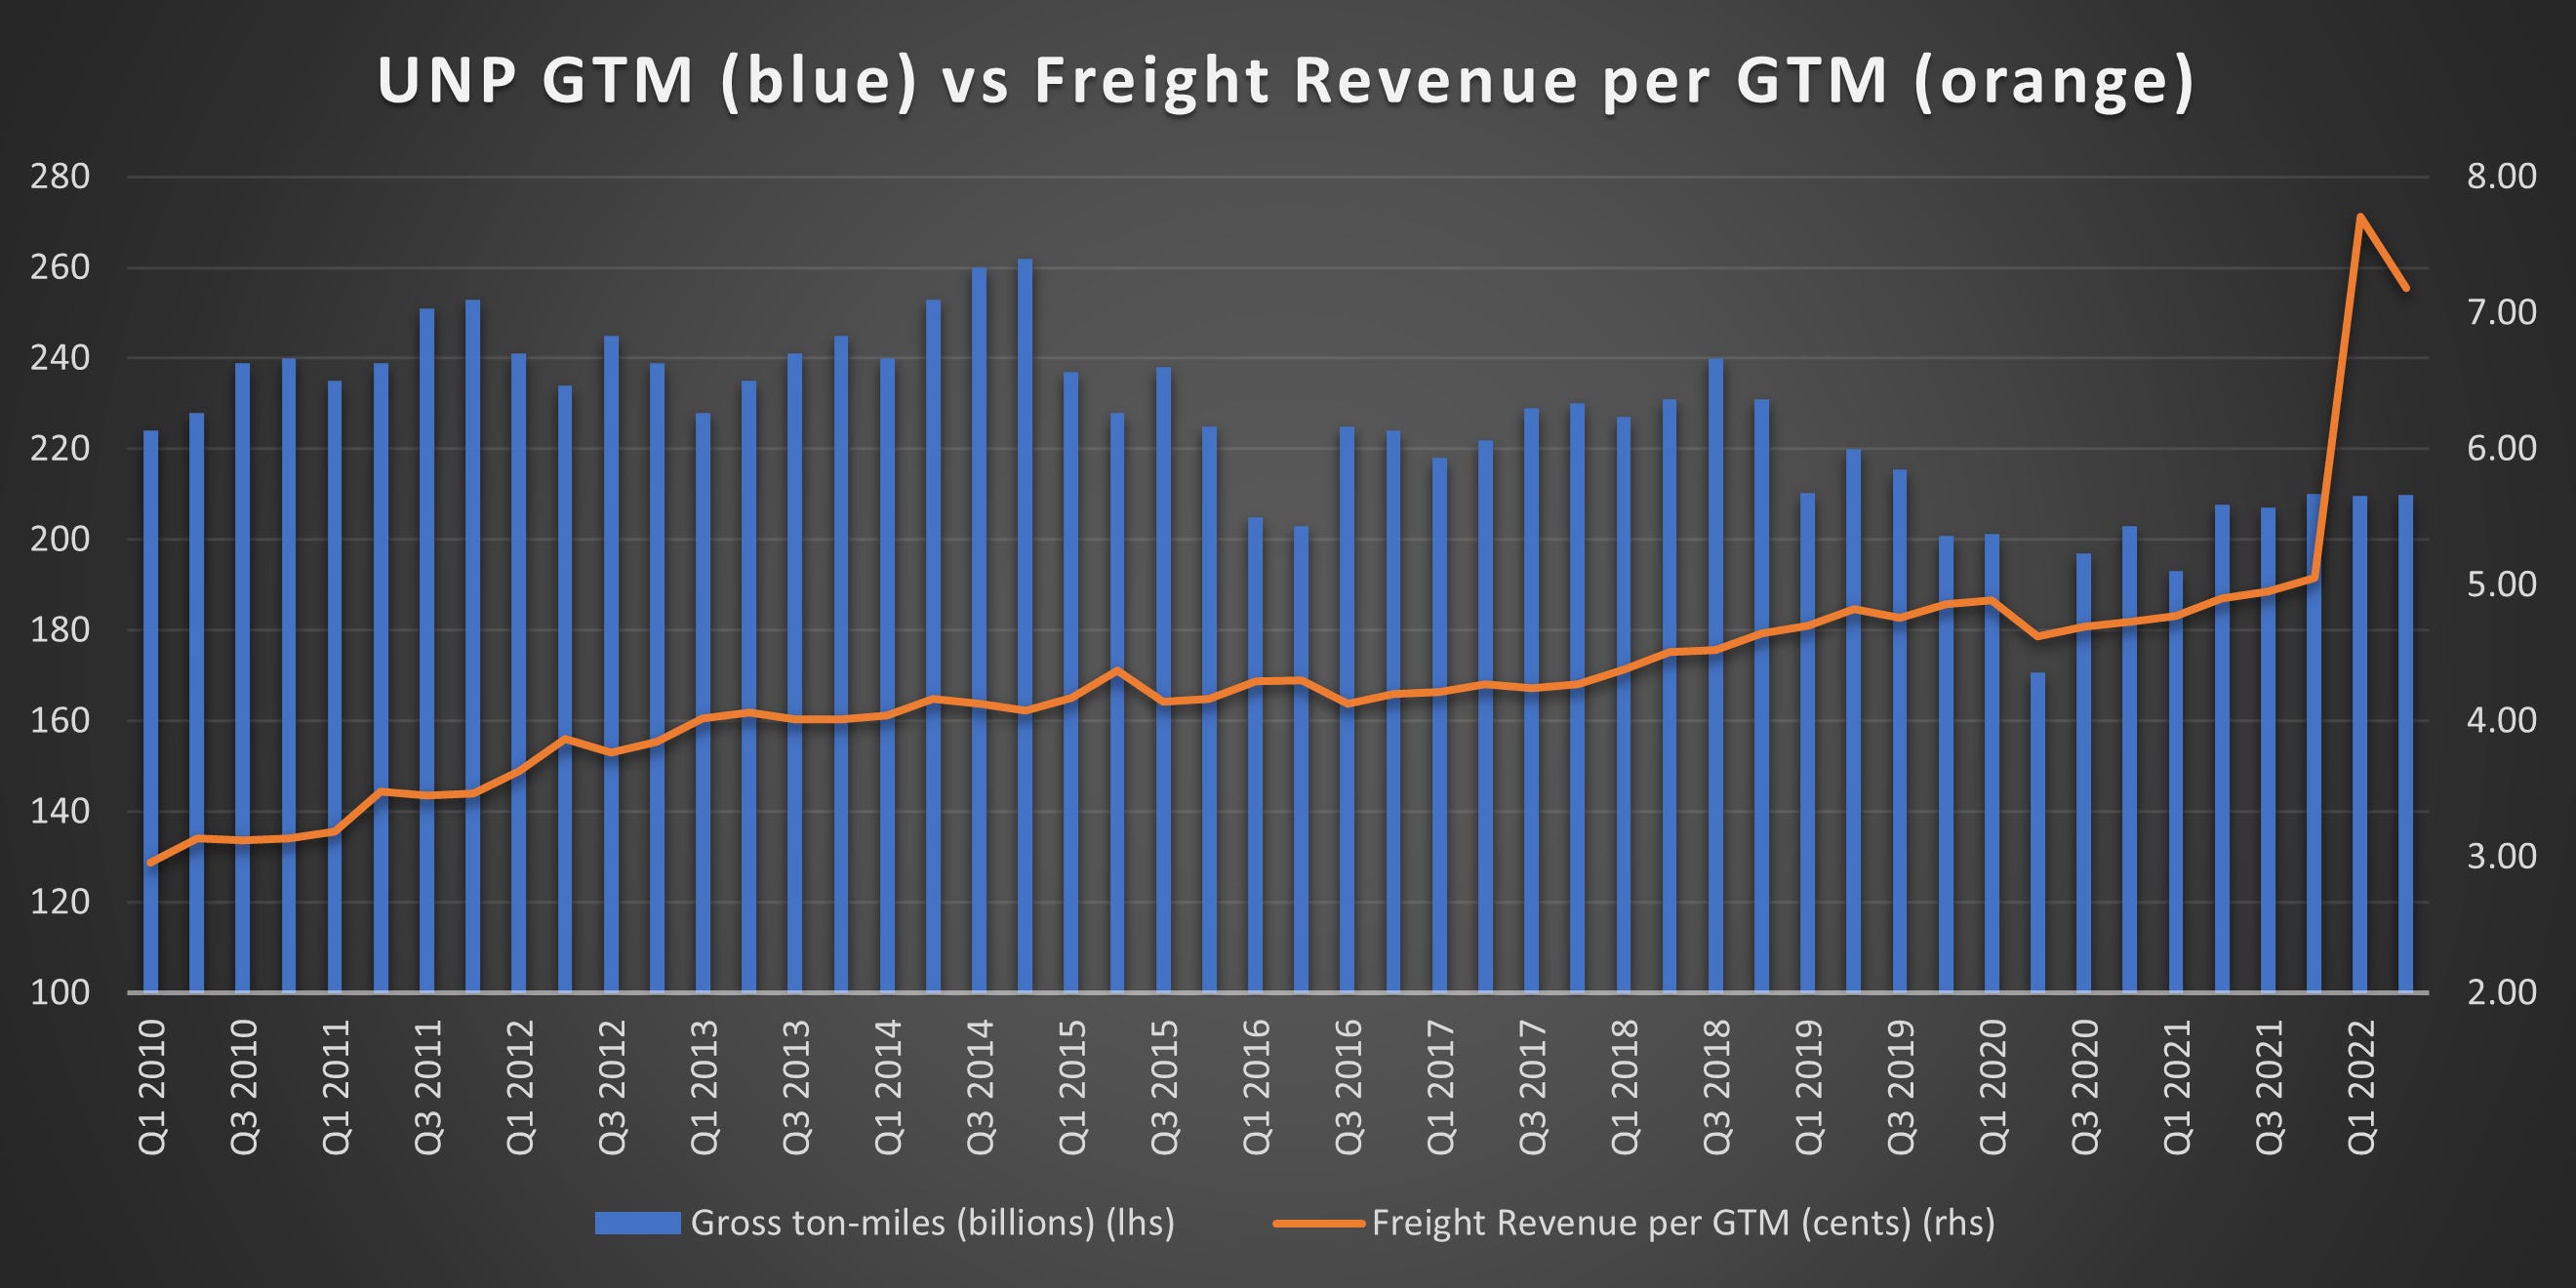
In terms of the total volume shipped, UNP saw declines in late 2015 and early 2016 when the economy came close to a recession. Another decline in 2018/2019 as they switched to PSR (reducing some service offerings) and a big dip in early 2020 during Covid but a quick bounce back. Overall though, GTM is only down a tiny bit over the last decade.
Freight revenues on the other hand have managed to increase from just under 3c per GTM in Q1 2010 to 5c per GTM in Q4 2021 which works out to a ~9% CAGR growth rate (ignoring the recent spike in Freight Revenue per GTM in the last 2 quarters). Warren Buffett said he’s fond of monopolies, and that’s probably why he went out and bought a railway (BNSF)!
All in all, no wonder employees can’t get a break! Business is steady and the number of employees is getting squeezed harder and harder.
This culling of staff has had a dramatic impact on UNP’s financials. Here is the company’s historical net income and EBITDA margin. Leaving aside the 2017 spike in NI margin (which was due to Trump’s 2017 tax cuts):
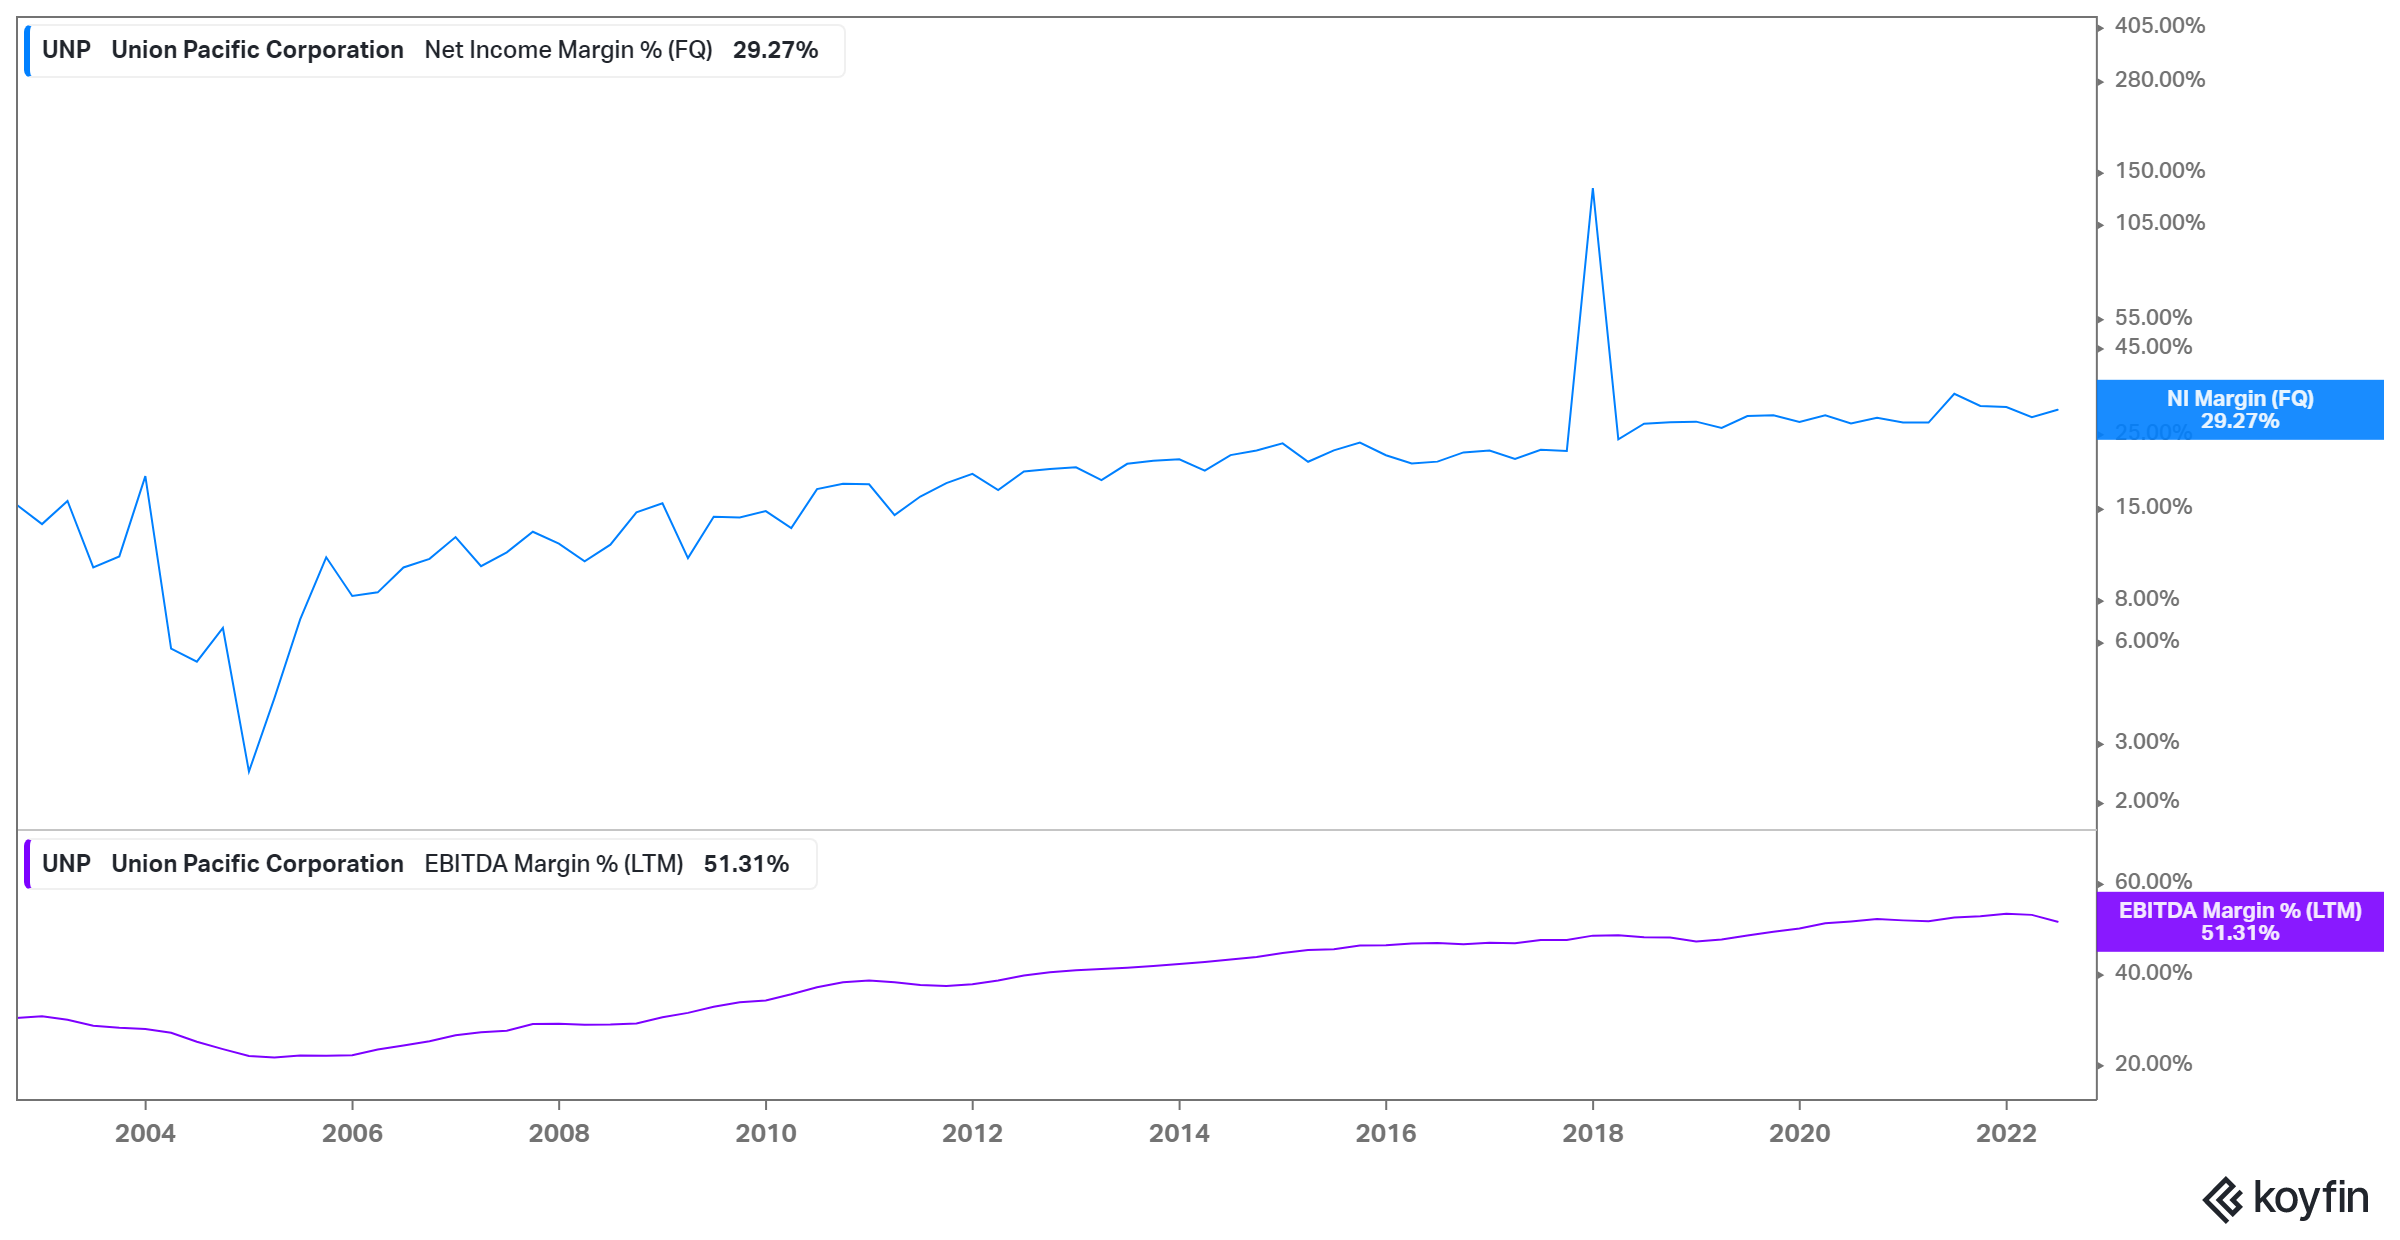
Coming out of the GFC, UNP had NI margins of 14%-17%. Prior to the GFC, the NI margin hovered between 12% and 15%. It’s now just below 30%. UNP’s EBITDA margin has also climbed from 35%-38% to well over 50%.
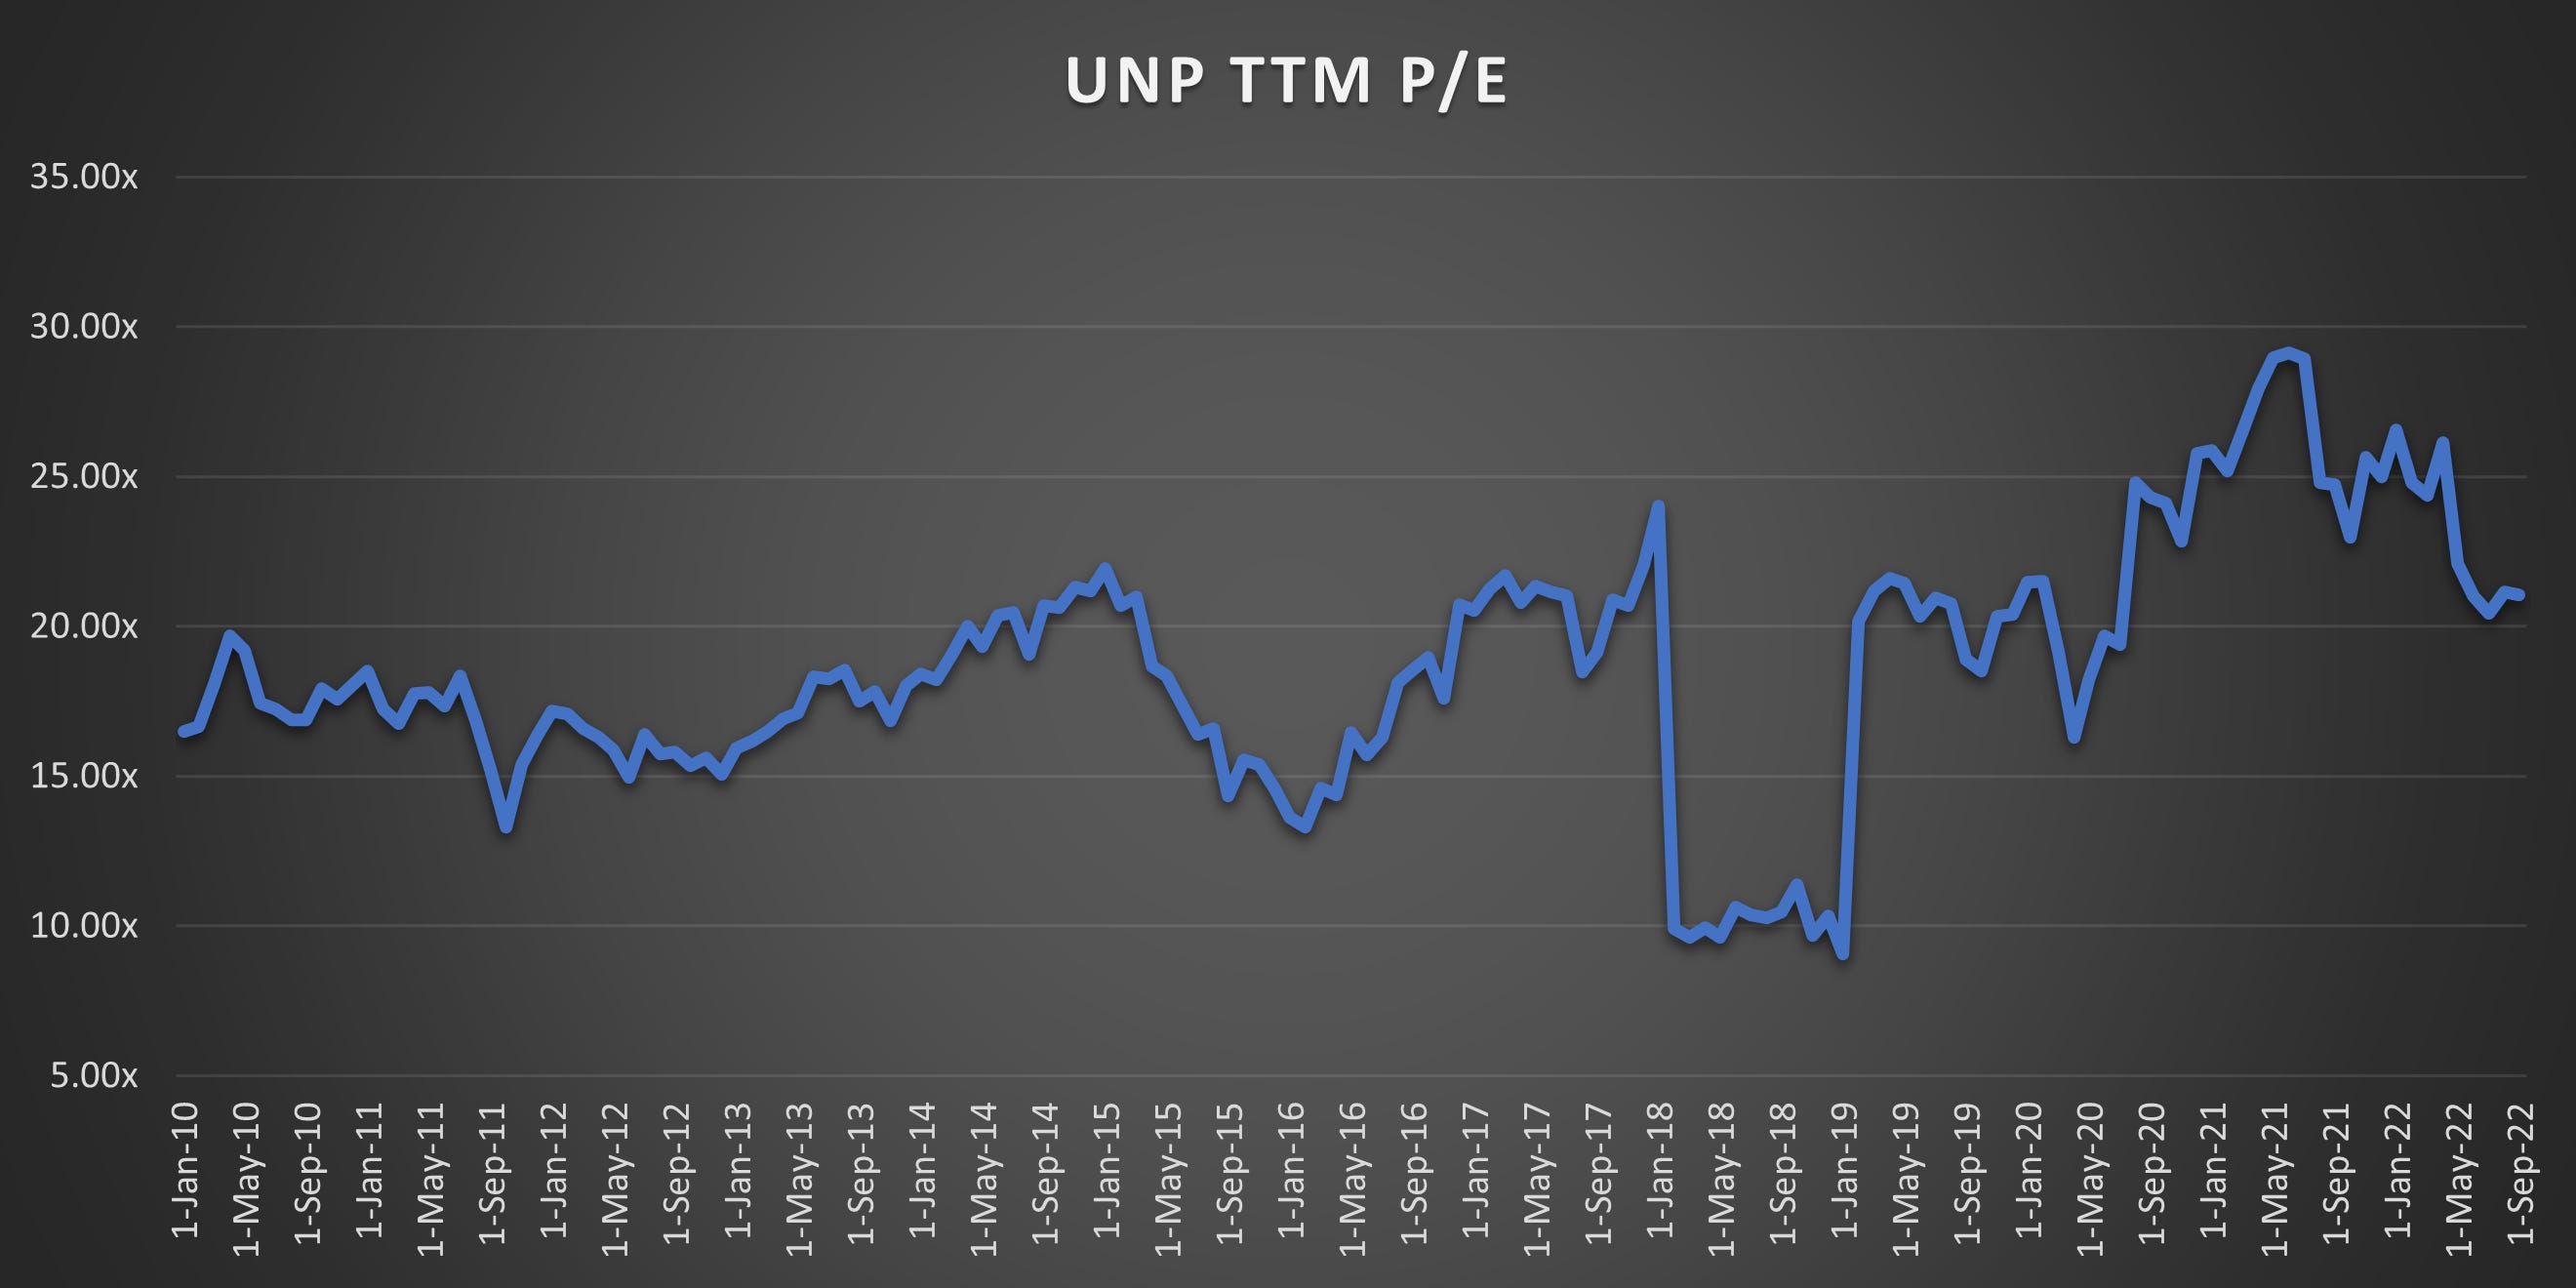
For a short period of time, investors rewarded the company with a higher valuation. The company’s P/E ratio (TTM) averaged ~17.5x from 2010 to 2014 and is now at ~21x after the recent pull-back (the P/E ratio fell in 2018 due to the spike in income from the 2017 Trump tax cuts).
While the company’s share price was re-rated higher, so was the market. So I deducted UNP’s P/E ratio from the S&P P/E for a better picture. From 2010 to 2014, the company’s share price traded at a slight premium to the market. During the economic slowdown in 2015/2016 and the Covid crash in 2020, the company traded at a pretty significant share price discount.

Overall, in good economic times, the company trades at a slight premium to the market, and in bad times it has traded at a significant premium to the market.
Putting It All Together
At this point, you're probably thinking “so what”. The company has record high profitability levels, but then so do most US companies that I look at. But this is looking at things in the rear-view mirror. What if things aren’t so rosy (or profitable) for US companies going forward?
Here are 3 highly simplified scenarios.
For the sake of simplicity let’s say that revenue grows at 5% CAGR (2% real growth, 2% inflation, and 1% due to squeezing customers or something else) for all scenarios and that tax rates stay the same.
Scenario 1 - The Apple Outcome: Margins remain the same (net income margin of 30%), dividends grow in line with revenues (5%), the company continues to repurchase 4% of shares O/S every year and the shares end the decade at a 20x P/E multiple.
Scenario 2 - The Backsliding Outcome: Margins revert halfway (net income margin of 22.5%), dividends grow in line with revenues (5%), the company repurchases 2% of shares O/S every year and the shares end the decade at a 16x P/E multiple.
Scenario 3 - The “Doomsday” Outcome: Margins revert all the way back to 2010-2014 levels (net income margin of 15%), dividends grow in line with revenues (5%), and the company’s shares outstanding remain flat (no money for share buybacks) and the shares end the decade at a 12x P/E multiple.
So how do each of these scenarios play out? First, keep in mind that UNP’s shares have returned about 15.5% CAGR over the last decade.
In the Apple Outcome (scenario 1), the shares would end the decade around ~$460/share and your total return over this period would be about 13.5% CAGR. I called this the Apple outcome because while the company hasn’t grown specularly over the last 5 years, it’s been immensely profitable which has allowed management to buy back a massive amount of shares and significantly shrink the share count. The net result has more than offset the sluggish topline growth.
In scenario 2, the shares end the decade around ~$240/share and you’re left with a ~4.7% CAGR total return. Not awful, but if you subtract the (assumed) 2% inflation then you’re left with a 2.7% CAGR real total return. This is a pretty sharp step down for investors whose past decade of investing experience (and likely go-forward expectations) was in the double digits.
In the final scenario (the Doomsday outcome for investors), the share price ends the decade at ~$105/share and investors are left with an 8-year total return of roughly -5.25% CAGR. And that’s on a nominal basis as on a real basis (again assuming 2% inflation) it would be -7.25%. Ouch! Now you might say that 12x P/E is too harsh. But 12x is about what the company’s valuation troughed at during the last 3 recessions and bear markets (Dotcom bubble, GFC & Covid). On top of that, from 1970 to 1990 the company’s shares almost never traded for more than 10x P/E.
And that’s why I think corporate profitability will be one of the most important things to watch over the next decade. High corporate profitability will give management teams lots of capital to fund corporate buyback programs as well as M&A even if topline revenue growth disappoints.
However, if profit margins do come under pressure (and there’s a variety of possible reasons), then the future expected returns become a lot more negative. This may seem hypothetical, but this is largely what’s happened over the last decade with European, Japanese, and EM equities.
There are three pushbacks that I can think of. The article is already getting pretty long so I’m not going to discuss them in depth but I’ll just briefly highlight them.
First, the markets are dominated by tech giants with minimal CAPEX requirements and historically abnormal levels of profitability. This is true! However, every company was a tech/growth company at some point in time. Railways were the growth stocks of the 1840s & 1850s. Cars and radios led the growth bubble of the 1920s. American Express, Alcoa, Anheuser-Busch, and 47 others were considered the growth stocks of the 1960s Nifty Fifty bubble.
One day we’ll look back at Microsoft, Apple, Amazon, etc. as boring blue chip companies (it’s already happened with Paypal, eBay, Cisco, etc.). Whether that happens within the next ten years (or later) nobody knows.
Second, corporate profitability is unlikely to decline because the consolidation (aka monopolies) and the market power of companies is simply too strong. We’ve seen consolidation across all industries in the US and that’s been a real boon for corporate profit margins.
But, it’s often at these peaks in corporate power that significant anti-trust sentiment galvanizes enough of the population and politicians to make significant changes (such as in the 1890s and 1970s). Already investors and executives are grumbling about Lina Khan and the FTC. But I think this is just the start of the trend.
Finally, there’s the age-old assertion that robotics and AI will replace many (or most) workers. While I’m no expert in this field I would like to point out a couple of things. First, we’ve seen massive and continual amounts of “robotization” since the beginning of the industrial revolution. Some jobs disappear, while new jobs are created. There are just as many employed today as there have been in most of history.
Lastly, there’s always a lot of hype surrounding robotics, AI, and machine learning but there’s been hype around these areas for decades (and very little to show for it). Much like fusion energy, there’s lots of hot air, but at least in my opinion not a lot to show for it (yet).